The delivery price is calculated during checkout based on your location and the goods ordered. Our basic delivery prices are:
Delivery within United Kingdom: £12.00 +VAT
Delivery Service: Next working day*
* For products that are in stock and the order received by midday.
Some products go through a final configuration and calibration before being shipped. If the calibration labs are busy this can add up to two days on to the delivery schedule but guarantees a fresh calibration.
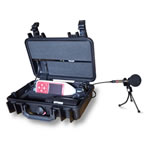
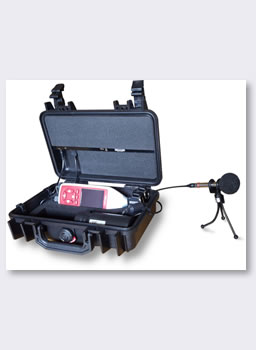
The Noise Nuisance Recorder measures the sound levels from neighbour noise as well as recording the audio for evidence purposes.
For use by environmental health officers, housing associations and concerned home owners, the recorder includes a precision grade Sound Level Meter, Calibrator and Microphone to provide the following features:
The Noise Nuisance Recorder is taken to the residence with the problem and carried inside a simple shoulder bag to avoid attracting the attention of the neighbours. It is very quick to set up before being left to measure sound levels continuously.
When the complainant hears the problem noise (dog barking, shouting, music, etc.) they press the button on the remote control to start the audio recording. A light on the case shows that the noise is being recorded. A "pre-trigger" ensures that 30 seconds before the button is pressed is included in the recording - 30 s is the default, it can be changed.
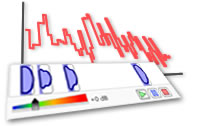
After a suitable period of time, usually a few days to a week, the measurement process can be stopped and the equipment returned to the office for analysis. After downloading the measurements you are presented with a Time History graph showing the sound levels throughout the measurement period. Markers indicate the time audio samples have been recorded. Listening to the audio confirms the source of the noise and is essential for evidence purposes.
When a resident complains of excessive noise from a neighbour there is often more happening behind the scenes, such as a neighbourly fall out over a number of other issues. In these situations the complainant could be over sensitive to noise that would not normally bother them, or could be falsely exaggerating the noise levels involved. For the authority involved (environmental health, housing association, police, etc.) it can be difficult to separate the genuine complaints from the false ones.
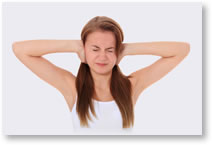
The purpose of the Noise Nuisance Recorder is to give the resident the opportunity to show that the noise levels in question are genuinely excessive or of an abusive or anti-social nature. This is extremely important as excessive neighbour noise is very difficult to live with, causing a loss of sleep, increased stress levels and the resultant damage to health.
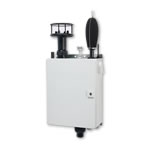
The noise nuisance recorder is designed for monitoring and recording noise from neighbours. It is intended to be installed indoors, usually in the room where the noise is most problematic, and left running for a few days to give a good idea of the background noise levels and so that the complainant can record the actual audio as evidence.
As the Noise Nuisance Recorder includes a sound level meter (either a Class 1 or Class 2 data logging, integrating meter), it can be used for many other noise monitoring applications, as listed below.
The intended application for the Noise Nuisance Recorder is for monitoring excessive noise from neighbours.
Typical noise sources would include:
These devices are often used by local authorities, environmental health officers and housing associations to assess the severity of the problem before taking legal action. They are also used by home owners and tenants who need to prove to the authorities that they have a real noise problem.
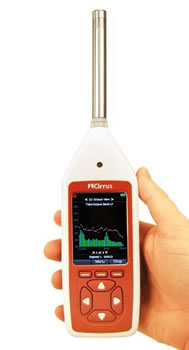
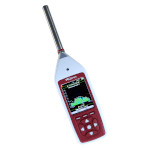
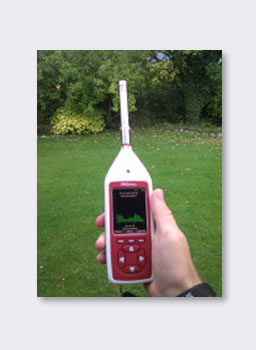
The Noise Nuisance Recorder includes a hand held Sound Level Meter. This is a Class 1 or Class 2 data logging, integrating meter that includes the standard environmental noise measurements (L10, L90, Leq, etc.) and the ability to make automatic repeating noise measurements. This makes the meter ideal for most environmental noise surveys. Should you need Octave or 1/3 Octave Band Filters then these can be added to the meter at the time of purchase or at a later date.
The NoiseTools software that is included connects to the meter and downloads all measurements.
The EU regulations and UK HSE guidelines state that noise at work measurements should be made using at least a calibrated Class 2 Integrating Sound Level Meter and that you should have a Calibrator to check the meter's function. The meters that are included in the NNR kits exceed these requirements and include all the measurements that you need to meet these regulations and guidelines.
The NoiseTools software includes occupational noise measurement reports.
The Noise Nuisance Recorder is very quick and easy to set up, leading you through the process of calibration and starting the measurement in order to avoid disappointment after a few unmanned days of missed measurements.
The meter runs either as a standard sound level meter (useful for any other noise measurements you need to make) or in "Noise Nuisance Recorder" mode when it is in the NNR case.
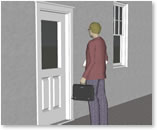
Take the Noise Recorder to the premises in question. The equipment is carried in a bag to avoid attention. As you only leave the locked Peli case and take the bag with you, it is not apparent to neighbours that you have left anything behind.
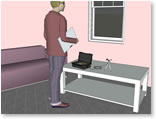
Set the equipment up in a location that will give the most representative recordings of the background noise and the problem noise. A power outlet is needed throughout the measurement period, although it will run for at least 10 hours on the internal battery if the power is lost for some reason.
After a suitable monitoring period, usually around one week, the sound level measurements and associated recordings can be downloaded to a computer for analysis and audio playback.
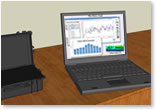
After monitoring the noise levels and making audio recordings of nuisance noise, you need to download these from the sound level meter to a computer to view, listen and generate reports.
The NoiseTools software is a key part of the NNR system and provides you with the ability to download measurements and recordings, view data and replay audio files directly from your PC.
The measurements are stored in a simple tree structure so you can easily find the information you need. You can tag data with a place, person or project to organise the information for later analysis.
If you are going to replay the audio recordings through speakers, NoiseTools has a calibration system built-in that lets you adjust the levels to accurately represent those at the time of the recording.
NoiseTools can be used with noise measurements and audio recordings made in either the Noise Nuisance mode or Hand-held mode and provides you with a powerful set of tools to view, analyse and store your information.
NoiseTools is supplied free from any installation or licencing restrictions.
)
)
Noise reports can be exported straight from the software to PDF, graphical or office document formats. These can be sent to other people to be viewed.
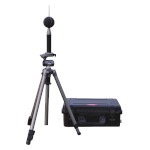
The most popular Noise Nuisance Recorder is the NNR-P-A1, which includes the following items:
| NNR-P-A2 | Noise Nuisance Recorder with Class 2 Sound Level Meter |
| NNR-P-A1 | Noise Nuisance Recorder with Class 1 Sound Level Meter |
Most of our customers monitoring neighbour noise request a Class 1 system, as this is the more accurate version and certainly the best if you are using it for legal purposes.
However, if you do not need a Class 1 then the NNR-P-A2 should be ideal. It includes a Class 2 Integrating Sound Level Meter and Class 2 Calibrator. This reduces the costs dramatically if you do not need the higher precision.
The Noise Nuisance Recorder is made up of the following main parts:
| Weight | 2.6 kg (including Peli Case, sound level meter and microphone) |
| Dimensions (Peli Case) | 296 x 212 x 96 mm (11.7" x 8.4" x 3.8") |
| Power | 100-240VAC (power adapter included) |
| Internal Power | 4 x AA cells provide > 10 hour operation in case of power failure |
| Mic Extension Cable | 1.5 m |
| Measurement Range | 20 to 140 dB RMS in a single range |
| Audio Recording | 20 hours in standard quality |
| Standards | IEC 61672 Class 1 or Class 2 |
| IEC 60651 and IEC 60804 Type 1 or Type 2 | |
| ANSI S1.4 Type 1 or Type 2 | |
| Measurements | LXYMax & Time History of LXYMax |
| LAeq, LCeq, LZeq, LCPeak, LZPeak, LAPeak, LAIeq | |
| Time History of LAeq, LCeq, LZeq, LCPeak, LZPeak, LAPeak, LAIeq | |
| Ln Values: 14 independent statistical values | |
| Audio recording during measurement | |
| Noise Floor | < 18 dB(A) for Class 1, < 21 dB(A) for Class 2 |
| Freq. Weightings | A, C and Z |
| Time Weightings | Fast, Slow & Impulse |
| Display | OLED with Ambient Light Sensor & Illuminated Keypad |
| Time History Rates | 10ms, 62.5ms, 125ms, 250ms, 500ms, 1sec, 2sec |
| Voice Tag | Up to 30 seconds of audio notes with each measurement |
| Environmental | Operating: -10°C to 50°C, Storage: -20°C to 60°C |
| Humidity: Up to 95% RH Non Condensing |